Top Stories

Gatwick worst for delays among UK airports

Daniel Sexton
BBC News, South East
Getty Images A passenger waits in the check-in area of Gatwick Airport following delays. She wears an orange top and black leggings, with a purple bag next to her on the floor.Getty Images

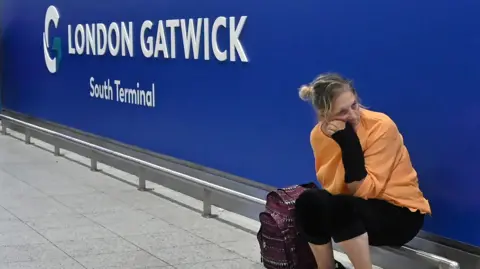
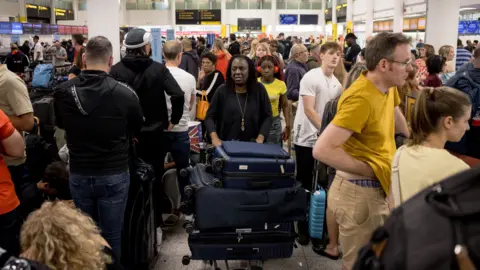
Gatwick has retained its position as the UK's worst airport for flight delays, as it continues to suffer from air traffic control (ATC) disruption, data shows.

Departures from the West Sussex airport, which mainly serves London, were an average of more than 23 minutes behind schedule in 2024, according to Civil Aviation Authority (CAA) data.

This is an improvement from the more than 27 minutes during the previous 12 months - but is still longer than at any other UK airport.

A Gatwick Airport spokesperson said: "Air traffic control restrictions in other parts of Europe have continued to impact the airport. Together with our airlines, we've put in place a robust plan... to improve on-time performance further in 2025."

Gatwick, which is the UK's second busiest airport, was badly affected by ATC staff shortages across continental Europe in 2024, suffering the same issue in its own control tower.

Flights from Stansted Airport had the second poorest punctuality record last year, with an average delay of more than 20 minutes, while in third place was Manchester Airport with a similar average delay time.

Getty Images People wait near check-in desks at Gatwick Airport with baggage.Getty Images

Belfast City Airport recorded the best punctuality performance in the UK for the second year in a row, with an average delay per flight of under 12 minutes.

Depending on the distance of the route and length of delay, passengers booked on flights from UK airports which are running behind schedule may be entitled to compensation.

However, ATC issues are considered to be an "extraordinary circumstance", meaning affected passengers are not entitled to compensation.

The Gatwick spokesperson said the airport was "the world's most efficient single-runway airport, with flights departing or arriving every 55 seconds".

Transport Secretary Heidi Alexander said in February that she was prepared to support Gatwick's expansion plan to bring its emergency runway into routine use, if the project is adjusted.

The airport has until Thursday to respond.

A Manchester Airport spokesperson says it is "committed to doing everything in our power to support all our carriers to achieve the best possible on-time departure rates".

The 10 worst UK airports on average for delays are:

  1. Gatwick - 23.6 minutes
  2. Stansted - 20.3 minutes
  3. Manchester - 20.3 minutes
  4. Southend - 20 minutes
  5. Birmingham - 19.9 minutes
  6. Bournemouth - 18.9 minutes
  7. Bristol - 18.8 minutes
  8. Cardiff - 18.6 minutes
  9. Luton - 18.6 minutes
  10. Heathrow - 18 minutes

Additional reporting by PA Media

Follow BBC Sussex on Facebook, on X, and on Instagram. Send your story ideas to southeasttoday@bbc.co.uk or WhatsApp us on 08081 002250.


Source link

Leave A Comment


Last Visited Articles


Info Board

Visitor Counter
0
 

Todays visit

42 Articles 7466 RSS ARTS 13 Photos

Popular News

🚀 Welcome to our website! Stay updated with the latest news. 🎉

United States

18.119.141.157 :: Total visit:


Welcome 48.449.444.457 Click here to Register or login
Oslo time:2025-05-01 Whos is online (last 10 min): 
1 - United States - 38.339.333.357
2 - United States - 276.244.66.229
3 - Singapore - 44.428.422.424
4 - Singapore - 44.428.45.94
5 - United States - 98.224.37.968
6 - United States - 53.559.555.585
7 - Singapore - 47.028.06.030
8 - Singapore - 47.008.97.007
9 - United States - 88.886.242.844
10 - Singapore - 57.528.25.32
11 - United States - 3.834.888.883
12 - Singapore - 47.118.111.141
13 - United States - 58.555.555.550
14 - United States - 54.887.82.885
15 - United States - 35.373.33.63
16 - Singapore - 47.728.96.725
17 - United States - 44.666.680.679
18 - United States - 44.225.62.66
19 - Singapore - 41.128.111.10
20 - United States - 52.72.228.25
21 - United States - 34.225.243.030
22 - United States - 02.203.230.000
23 - United States - 1.15.220.106
24 - United States - 53.0.338.339
25 - United States - 52.284.78.8
26 - United States - 3.535.85.75
27 - United States - 54.235.172.96
28 - United States - 52.6.67.88
29 - Singapore - 47.323.334.233
30 - United States - 98.81.66.171
31 - United States - 98.82.39.243
32 - United States - 52.44.223.324
33 - United States - 43.666.246.236
34 - United States - 54.356.55.347
35 - United States - 00.203.002.006
36 - United States - 44.207.69.906
37 - United States - 14.231.118.162
38 - United States - 55.504.574.539
39 - United States - 23.22.99.89
40 - United States - 64.266.45.47
41 - United States - 3.224.255.550
42 - United States - 34.235.555.544
43 - United States - 52.205.949.924
44 - United States - 83.88.243.24
45 - Singapore - 77.79.796.797
46 - United States - 56.607.67.667
47 - Singapore - 47.448.48.48
48 - United States - 54.275.772.708
49 - United States - 52.203.752.237
50 - United States - 44.195.51.71
51 - Singapore - 47.828.822.880
52 - United States - 507.22.208.39
53 - United States - 94.994.969.49
54 - United States - 44.777.777.36
55 - United States - 34.196.114.171
56 - United States - 54.440.455.49
57 - United States - 98.83.72.38
58 - United States - 54.957.99.244
59 - United States - 66.260.662.679
60 - Singapore - 17.121.11.211
61 - United States - 884.78.85.882
62 - United States - 32.233.333.334
63 - United States - 54.70.409.43
64 - United States - 28.228.242.222
65 - United States - 52.200.842.899
66 - United States - 54.13.140.51
67 - United States - 22.249.77.242
68 - United States - 52.3.102.51
69 - United States - 3.443.484.34
70 - United States - 52.15.92.83
71 - Singapore - 17.128.36.32
72 - United States - 34.224.832.285
73 - United States - 50.66.72.685
74 - United States - 8.887.288.887
75 - Hong Kong - 000.32.208.70
76 - United States - 3.228.224.252
77 - United States - 66.206.63.265
78 - Singapore - 44.428.446.430
79 - United States - 44.200.203.220


Farsi English Norsk RSS